
Let’s Talk Bookish is a weekly meme that was originally created and hosted by Rukky @ Eternity Books starting in August 2019, and was then cohosted with Dani @ Literary Lion from May 2020 to March 2022. Book Nook Bits has hosted since April 2022, with Dini at Dini Panda Reads as co-host from February 2025.
Let’s Talk Bookish 5th September:
In Which Season Do You Do Your Best Reading?
(Jillian @ Jillian the Bookish Butterfly)
Prompts: Is there a month, quarter or other specific time of year when you do your most reading and why do you think that is? Does this tend to fluctuate every year or is your reading pretty ‘steady’?
I think this varies year to year – it’s completely dependent on what I have going on at the time, when I’ve taken annual leave, if I’ve been doing any sort of travelling, etc. I think generally, I tend to read a little more in winter, when there’s less going on, and I have leave around my birthday and Christmas, etc. During the summer, I might be more sociable, so typically this eats into my reading time.
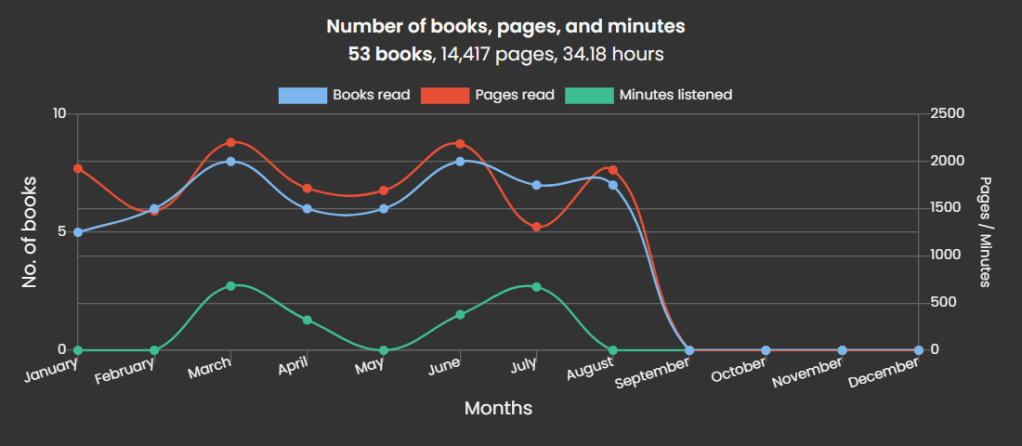
So yeah, it fluctuates every year. It’s very much impacted by ‘events’ – my reading hugely increased during 2020 (for obvious reasons). I was made redundant in 2021 and spent the summer unemployed, so my reading increased then. Since then, I’ve had periods where I’ve been on long term sick from work, and books have offered a comfort, so of course, I tend to read more. Storygraph does allow you to look at your stats across a year, so let’s take a look at mine, starting with 2022.
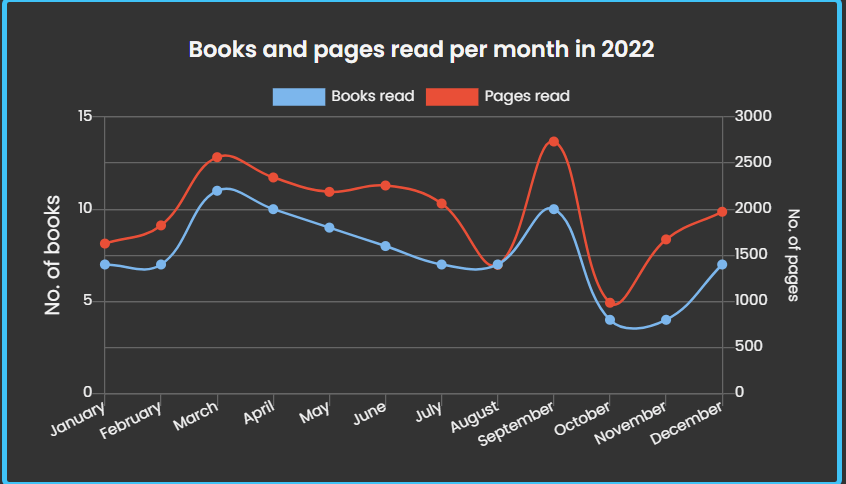
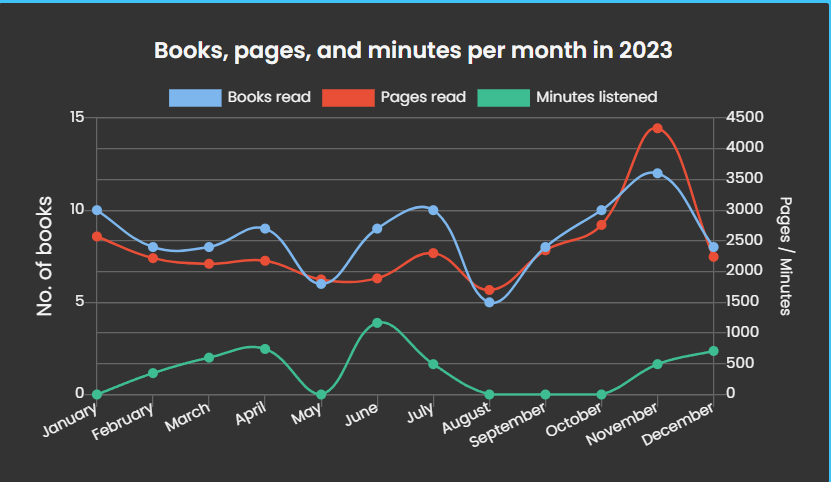
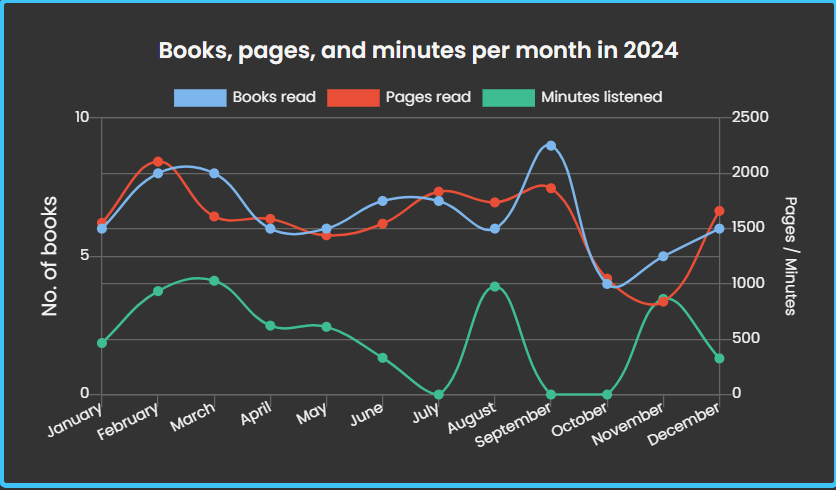
So yeah – I think these very much show there’s no one period during the year when I read more! It’s interesting (to me anyway) that October changes so much, with it going down in 2022, gradually increasing in 2023, and going down again in 2024.
Meanwhile, looking at this year, it seems to be a bit more in line with 2024, though I’m surprised my January reading isn’t a little higher as I was off work for that month. My reading over the last few months has remained consistent, however. I also only use Storygraph to log books, not pages read or minutes listened to, so it’s not quite accurate with those numbers.
So there we go – there isn’t one set period of the year where I read more, and it really fluctuates year on year! Will be interesting to revisit this at the end of the year and see how I’ve done through the last four months compared to previous years.

These graphs really make me wish that I was better at keeping my Storygraph updated! 🤭 Love that you’ve included them in your post. It’s so nice to be able to visualize just how steady or fluctuating your reading actually is! Great post and thanks for joining LTB this week 🙂
LikeLike
I love that you included graphics! That’s awesome
LikeLike